Quickstart: the report interactive
Each Oxzeon report has an interactive that allows you to explore the backlinks ecosystem in detail.
TIP Press F11 to full-screen the browser window when viewing an Oxzeon report interactive.

1. Report title
Most report titles follow a standard format which contains the following components:
- The name of the principal domain
- The size of the core ecosystem, the maximum number of referrers per core domain, and the maximum number of referrers per referrer (e.g., 4x100x100)
- The date on which the data was sampled
- The outermost part of the ecosystem modelled (e.g., inner)
- The report version (e.g., R1, R3 etc.)
2. Graph visualisation
Depending on the selection in the quick analysis component, the graph visualisation shows all or some of the ecosystem modelled by the report.
Each node is a domain, and each edge (the curved lines) represents a backlinks relationship. The direction of a relationship (i.e., that domain A links to domain B), is indicated both by the curvature - flow is always clockwise - and animations on the edge when part of a selection.
You can interact with the graph visualisation several ways:
- Use your mouse-wheel to zoom in and out
- Hover over a node (domain) to see its name, and the names of all domains with which it has a backlinks relationship
- Clicking on a node will filter the data tab component to show details only for the clicked-on domain and ones it is connected with
- Double-clicking on blank space will reset the zoom and reset your selection
3. Quick analysis
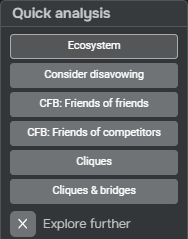
The quick analysis component focuses the graph visualisation component on the parts of the graph that are most relevant to key questions addressed by the report:
- Ecosystem - This shows the full ecosystem modelled by the report, and by default uses a palette that colours each domain by type
- Consider disavowing - This will apply a palette that colours all domains in the consider disavowing list using their spam score, whilst dimming all other domains
- CFB: Friends of friends - This will focus on domains in the consider for backlinks: friends of friends list, applying the domain type palette and dimming all other domains
- CFB: Friends of competitors - This will focus on domains in the consider for backlinks: friends of competitors list, applying the domain type palette and dimming all other domains
- Cliques - This shows a subset of the modelled ecosystem, focusing on cliques of domains connected via mutual relationships, whilst applying the domain type palette
- Cliques & bridges - This is almost identical to the cliques option, but adds edges for non-mutual relationships that exist within and between the cliques
The quick analysis component also contains the toggle that makes the explore further component visible.
4. Explore further
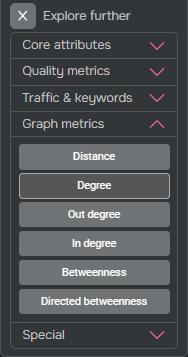
The explore further component is made visible using a toggle in the quick analysis component. This component contains groups of palettes that will re-colour the domains in the graph visualisation component to reflect a particular attribute:
- Core attributes - Such as domain type, and ecosystem backlinks
- Quality metrics - Including Ahrefs domain rating and spam score
- Traffic & keywords - Including organic and paid traffic
- Graph metrics - Graph and centrality measures, such as degree and betweenness
Options in the special group work slightly differently: instead of re-colouring domains, they put coloured rings around the relevant domains and do not override the currently selected palette.
5. Key

Each time you select an option in the quick analysis or explore further components, the key component
will provide information on the meaning of the palette that's currently being used to colour the domains (nodes) in the graph visualisation
component.
6. Data, notes, and legal tabs

Data tab
When no node is selected, the data tab component replicates almost all columns from the data tables for all domains shown in the graph visualisation component (excluding any that are dimmed). You can interact with the data tab several ways:
- Use your mouse-wheel to scroll up and down the data tab
- Click on the row headings to change their sort-order
- Hover over a row and the relevant node and its relationships will be lit up in the graph visualisation component
- Clicking on a row will select the domain in the graph visualisation component, and filter the data tab to show details only for that domain and ones it is connected with
- Clicking on the pink link icon in the domain name column will open that website in a new browser tab
- Clicking the pink chevron will minimise or show the data, notes, and legal tabs
Notes tab
If visible, this tab provides additional notes about the report, such as how domains were added to the whitelist and ignore list.
Legal tab
Legal information about Oxzeon and our partners.
7. Domain panel

This component appears when you click on a domain in the graph visualisation component, and contains all data from the appropriate row in the data tables. The domain panel is useful if you have minimised the data tab component, but still want to see detailed information for a domain. You can also minimise the domain panel by clicking on the pink chevron.
8. Colour spectrum panel
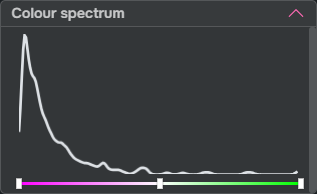
Some palettes activated by the explore further component, e.g., the one for degree, are spectral: they use different colours for the top and bottom of the range of available values, with white as mid-point. The colour spectrum panel appears when one of these palettes is active. Shown in the panel are three components:
- A line graph showing the distribution of domains along the spectrum of values (from lowest to highest, left-right)
- Handles that you can drag to focus the palette on a particular part of the spectrum
- A reset icon that will restore the original application of the palette (visible only when you mouse-over the panel)
You can also minimise the colour spectrum panel by clicking on the pink chevron.
9. Read the docs and downloads buttons
Click the Read the docs button to open the complete guide to Oxzeon reports in a new browser window (this guide!).
Click the Downloads button to see download options for:
- The report summary (as an MS Word file)
- The data tables for the report (as an MS Excel file)